This comprehensive guide delves into the intricacies of speaker sound graphs, specifically focusing on Spinorama data. Spinorama provides a 360-degree analysis of speaker performance, going beyond simple on-axis measurements to reveal a complete picture of sound distribution. Understanding these graphs is crucial for discerning a speaker's true capabilities and optimizing its placement for optimal sound quality. We'll explore the key elements of Spinorama visualizations, including on-axis and listening window responses, early reflections, sound power, and directivity indices. This detailed examination will equip you with the knowledge to interpret these graphs effectively and make informed decisions about speaker selection.This guide uses real-world examples of KEF R3 and Klipsch Heresy IV speakers to illustrate how Spinorama data reveals both strengths and weaknesses. By analyzing the graphs, we'll uncover potential issues such as crossover problems, resonances, and directivity inconsistencies. The goal is not simply to present data, but to empower you to understand the implications of these measurements and choose speakers that best meet your listening preferences and priorities, whether that prioritizes accuracy or loudness.
Pros And Cons
- Relatively flat on-axis response above 100Hz (within +/- 2dB)
- Good overall listening window response, generally tracking the on-axis response
- One of the best soundstages mentioned
- Steep roll-off below 30-40Hz
- Potential issue in the crossover region around 3kHz (listening window catches up to on-axis response)
- High-frequency loss off-axis as expected with a tweeter on the front
- Gets loud due to its 12-inch midwoofer, mid-range compression driver, and horn-loaded tweeter
- Poor on-axis response with significant dips and peaks across the frequency range
- Issues in crossover regions
- Resonances possibly due to port resonances or standing waves in the enclosure
- Lack of internal bracing and damping
Read more: Top 5 Best Bluetooth Speakers 2025: Ultimate Guide & Reviews
Spinorama Data: The Big Picture
Spinorama data provides a comprehensive view of speaker performance, measuring on-axis and off-axis responses in a 360-degree sphere around the speaker. This includes horizontal measurements around the speaker and vertical measurements above and below it. The resulting data creates several graphs collectively called a spinorama, offering a detailed sound profile.
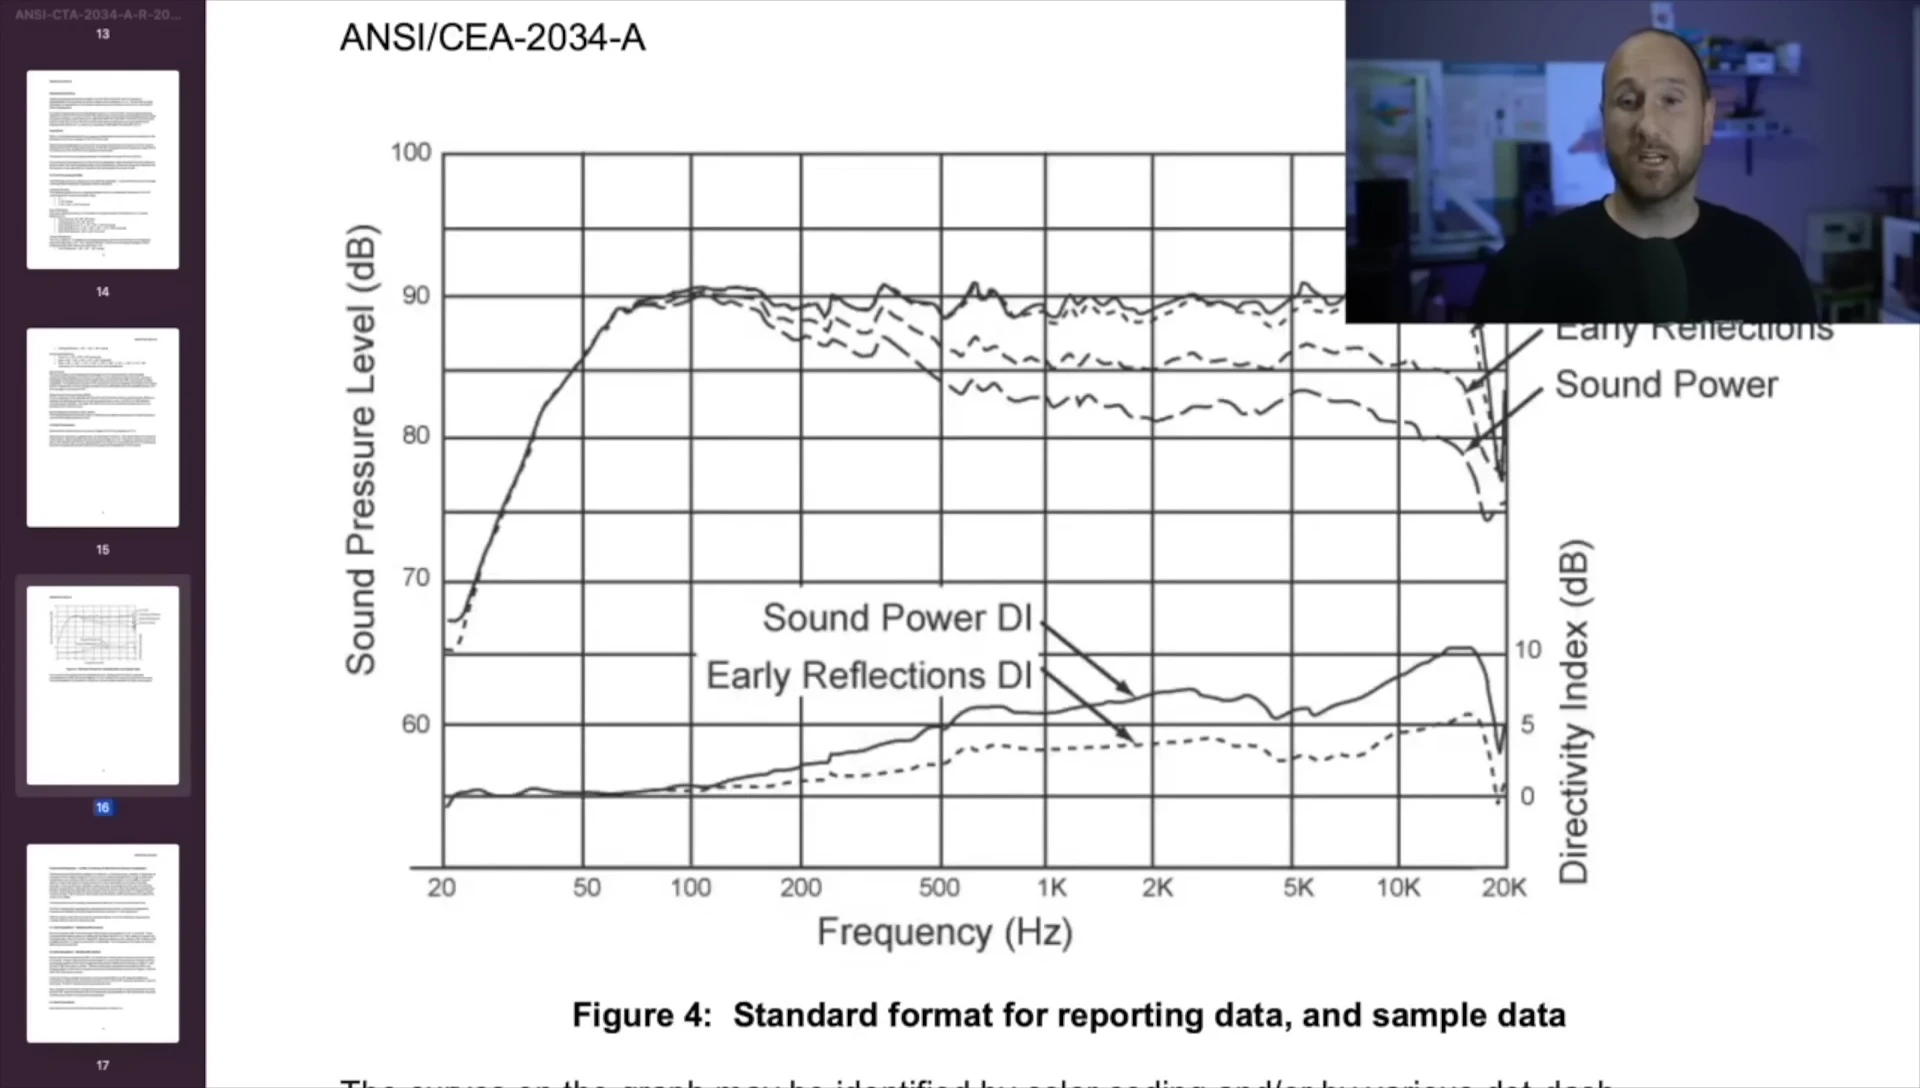
This method is standardized by the CTA 2034 standard, which provides a visual representation of the data's comprehensive nature. It allows for a holistic understanding of how a speaker distributes sound, crucial for optimizing its placement and achieving optimal sound quality.
The spinorama data is usually delivered via a script used by specialized software (like Clipple) to generate the visual graphics. These graphics are key for interpreting the raw measurement data and understanding the speaker's frequency response and directivity in various directions.
Interpreting the Spinorama Graph Lines
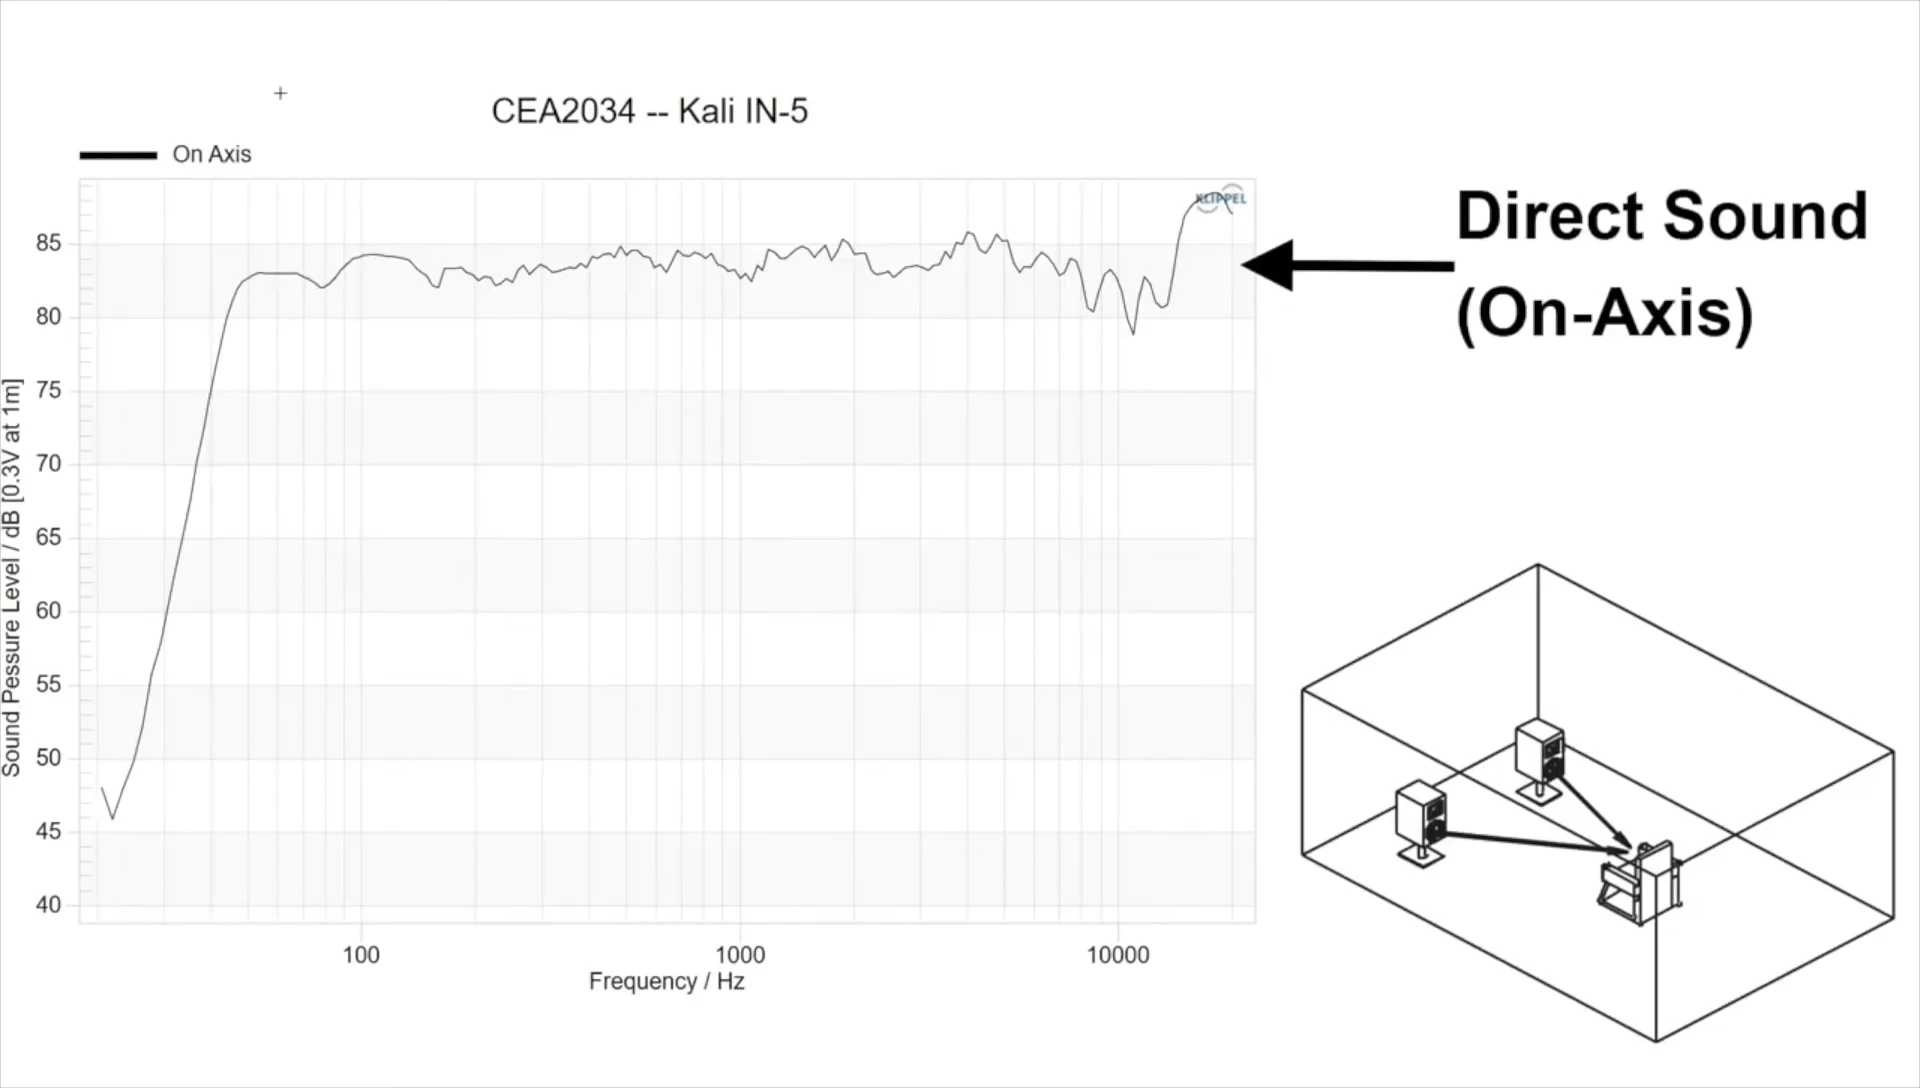
The black line represents the on-axis response, indicating the direct sound from the speaker to the listener. A flat line ideally represents consistent, undistorted sound across frequencies.
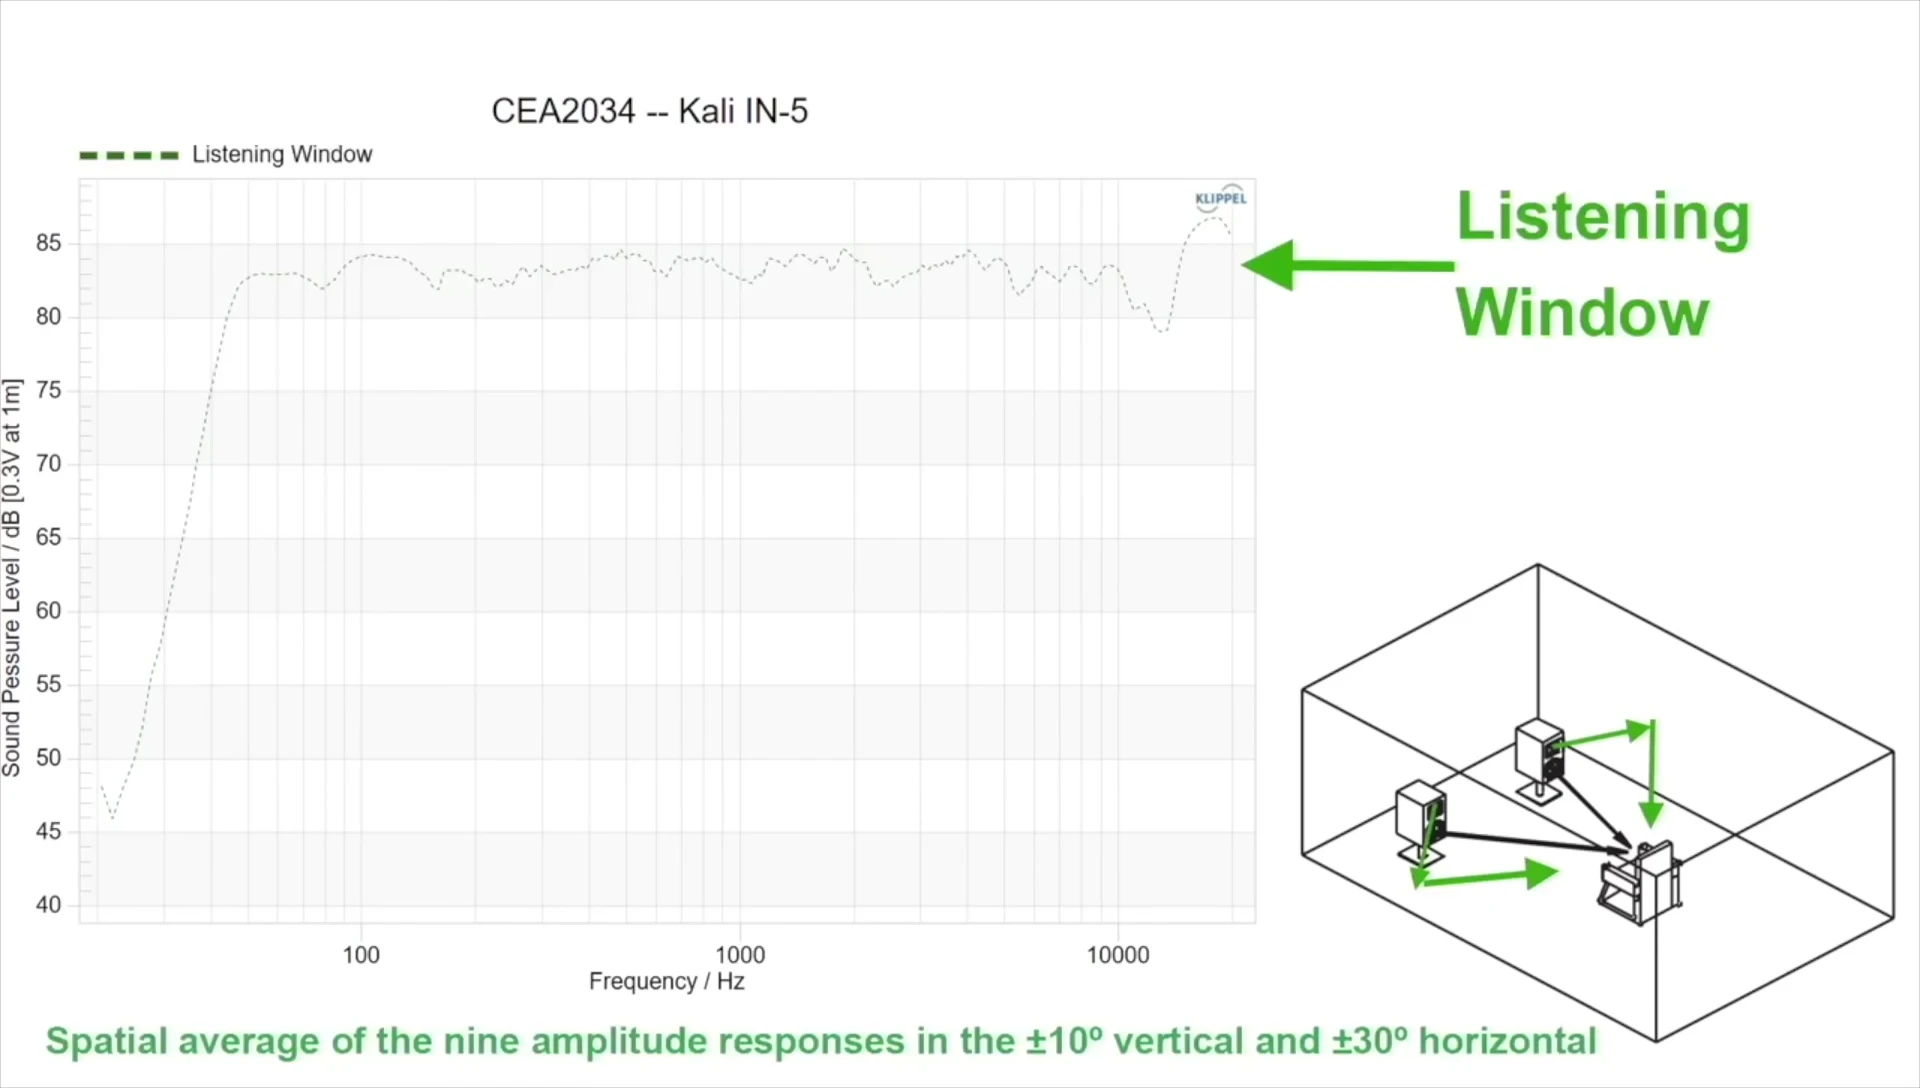
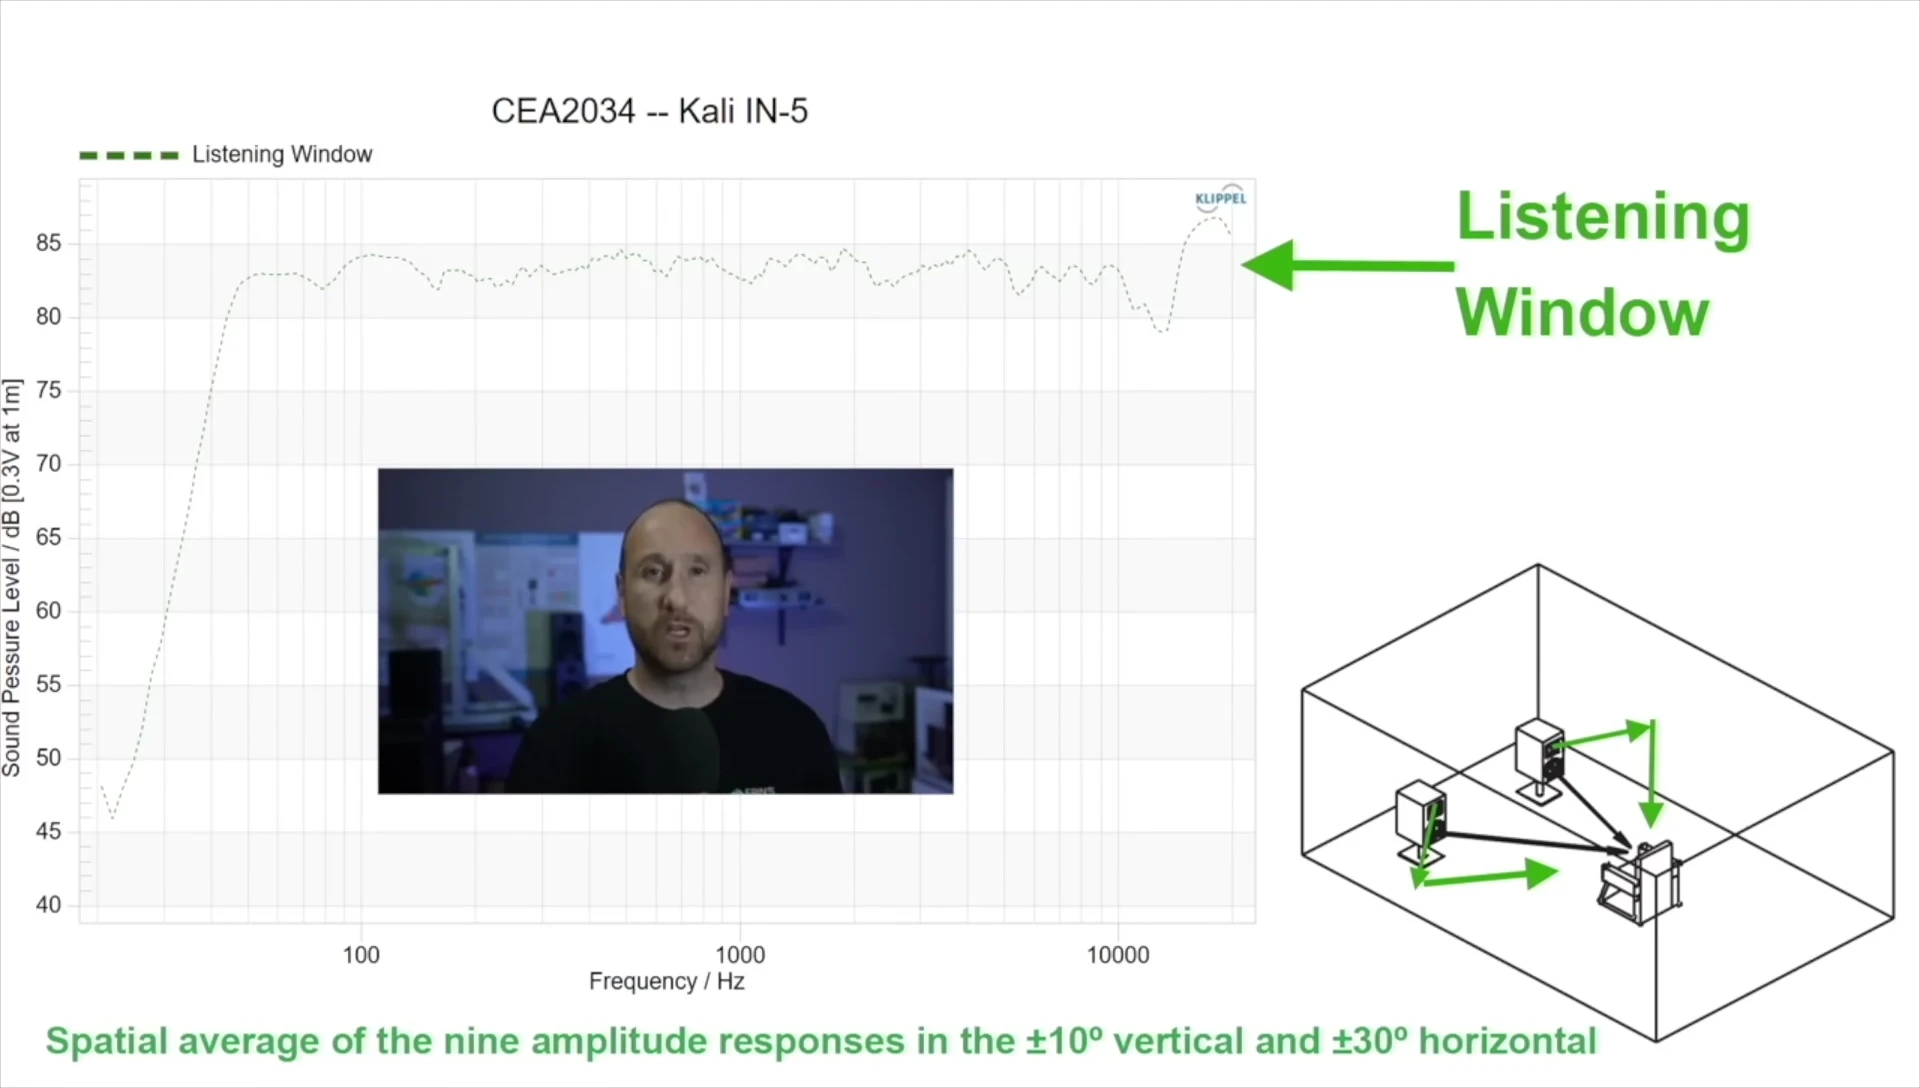
The green line represents the 'listening window', a composite of on-axis and near-axis measurements, reflecting what's typically heard in a typical listening position, even slightly off-axis. This is crucial for a realistic sound perception.
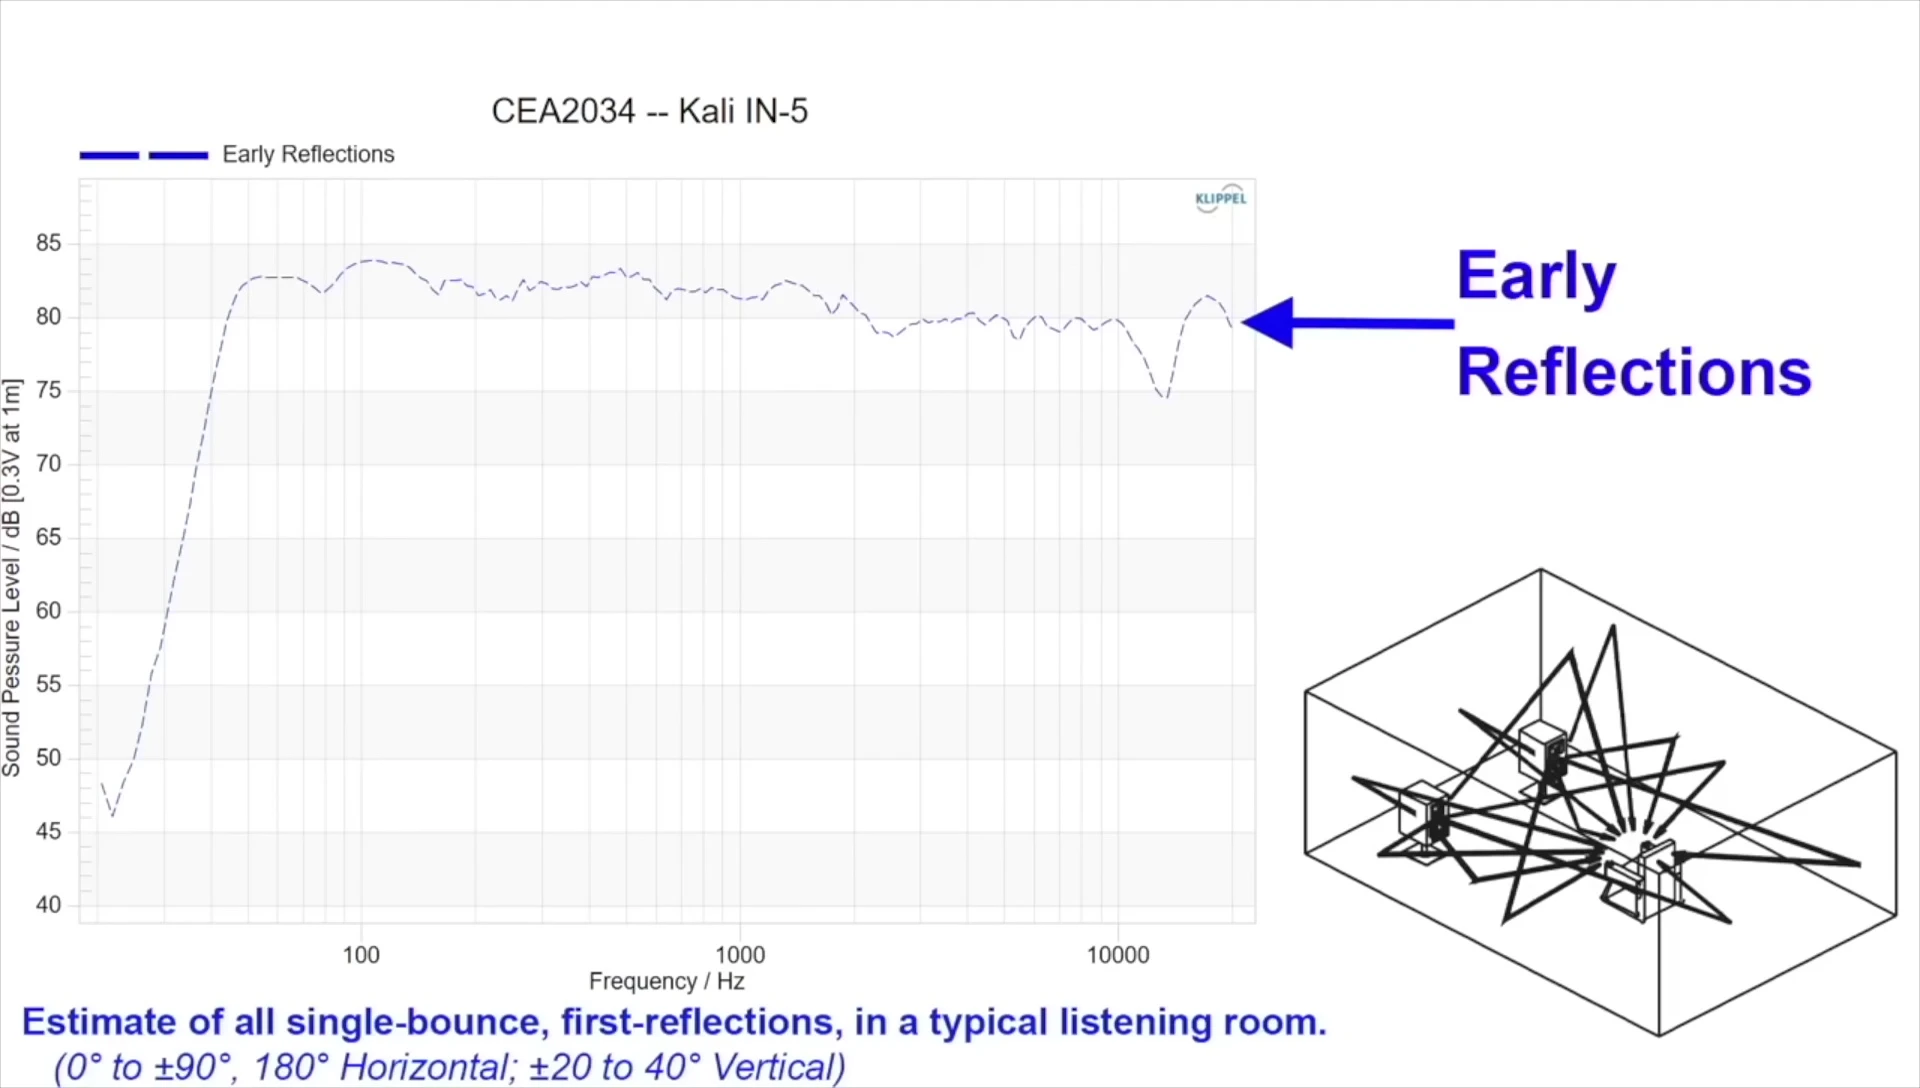
The early reflections line (often blue) shows the combined direct sound and first-order reflections from nearby surfaces. Analyzing this helps assess the impact of room acoustics on sound reproduction.
Sound Power and Directivity Indices
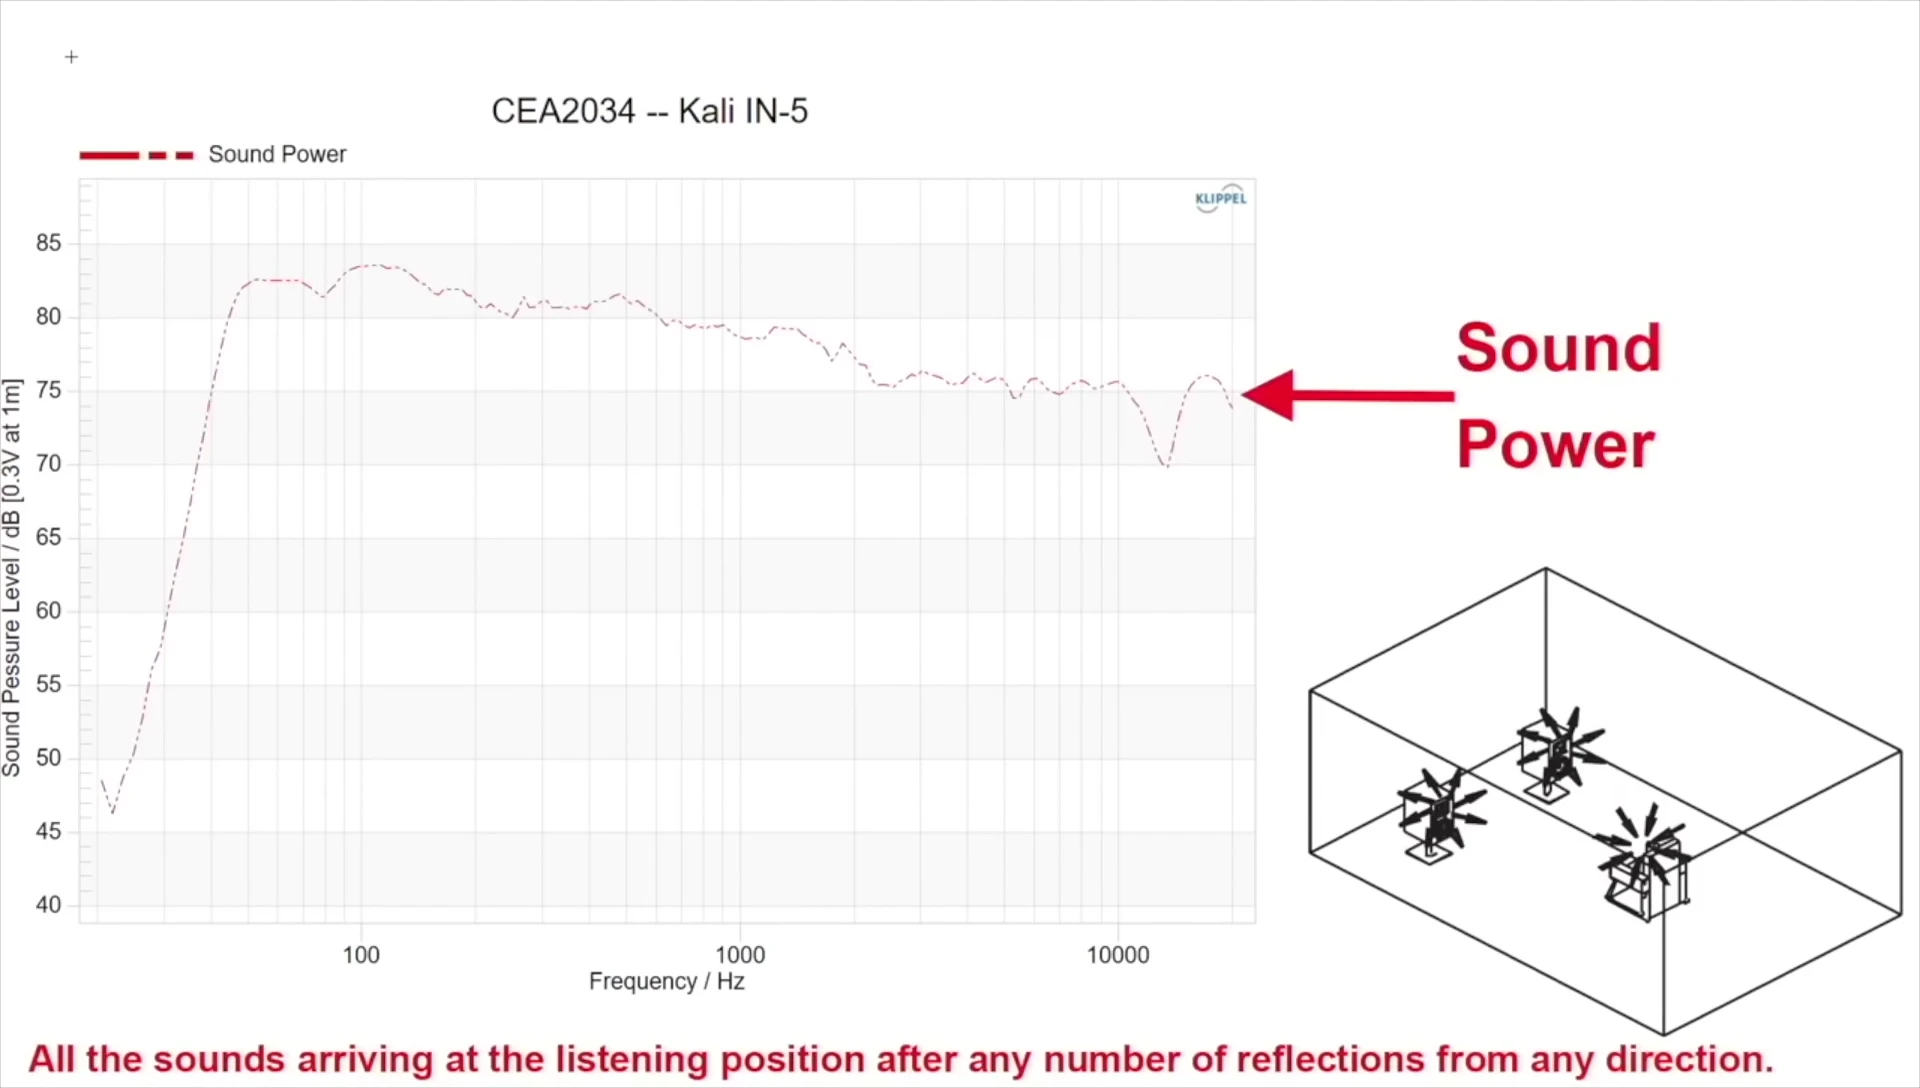
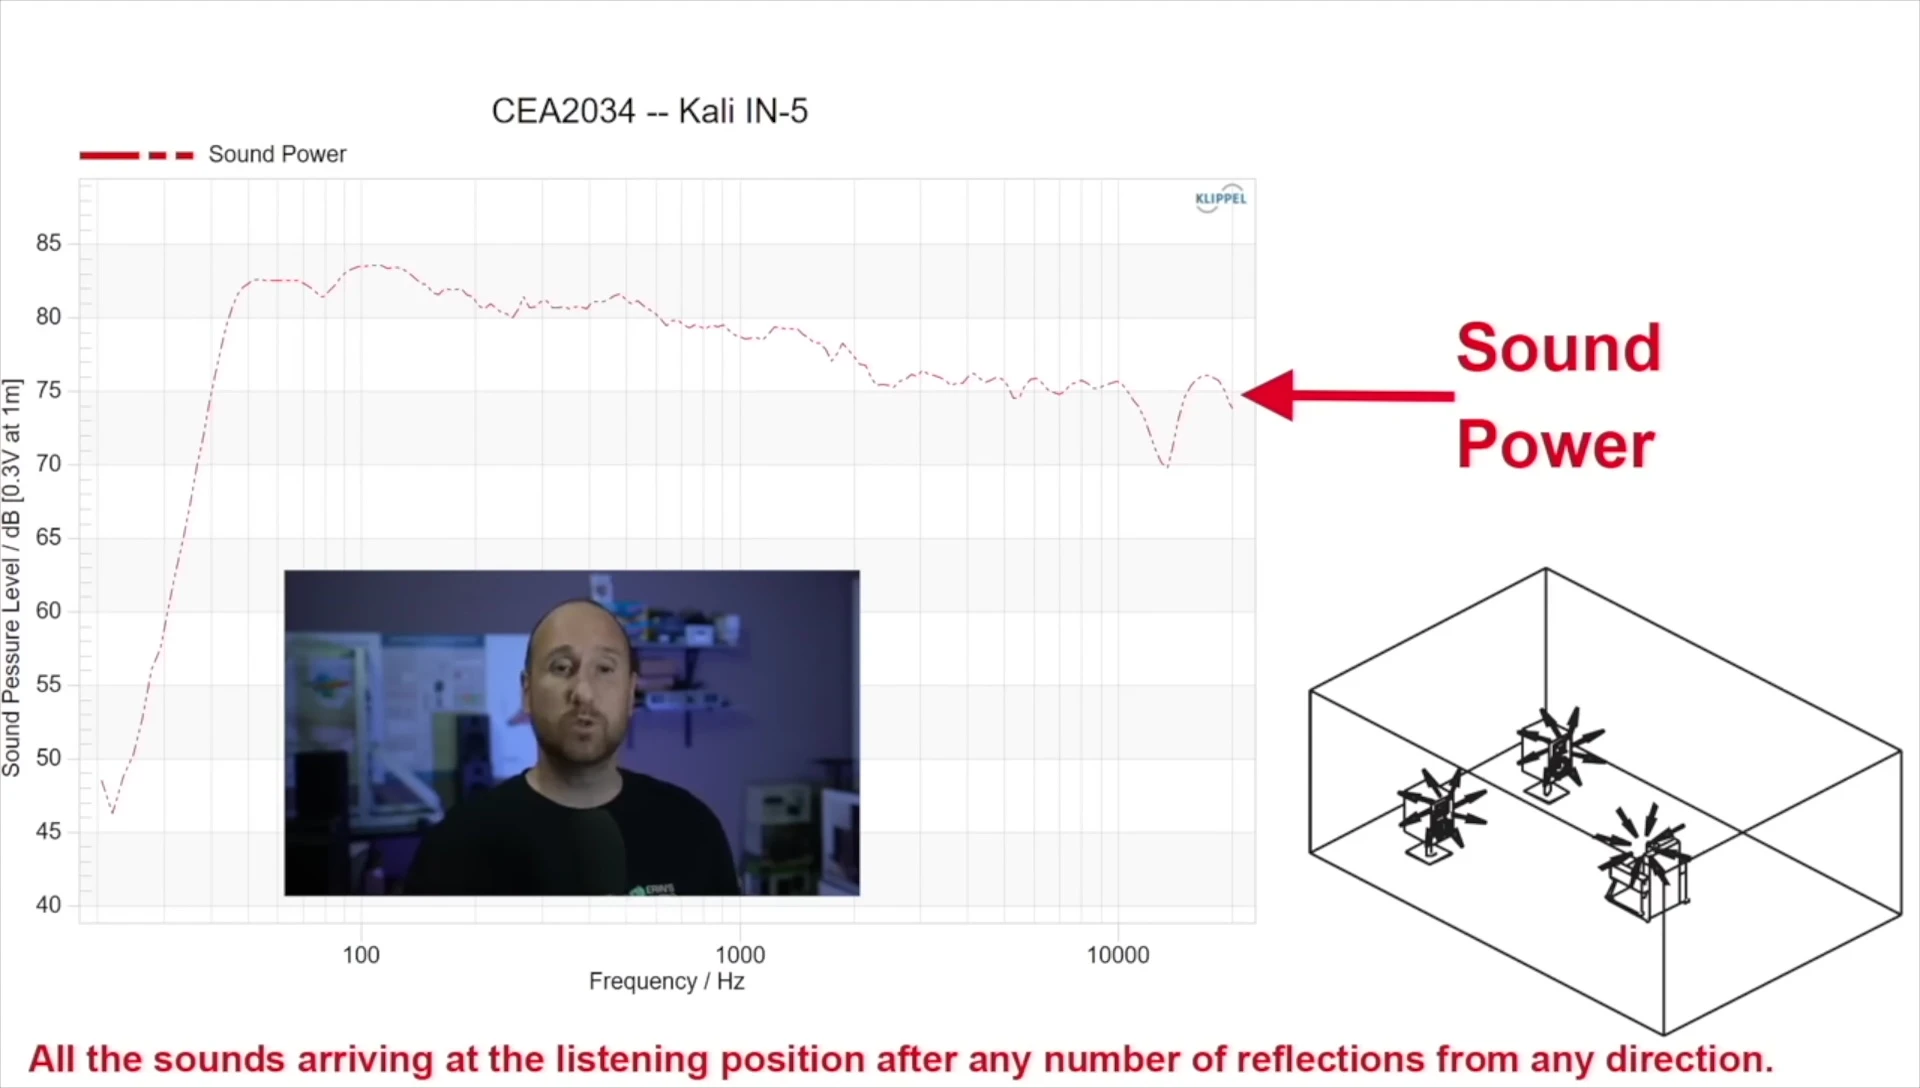
The sound power line shows the total sound radiated by the speaker in all directions. Analyzing this line gives insight into how much energy is distributed across the frequency range and into the room, crucial for room integration.
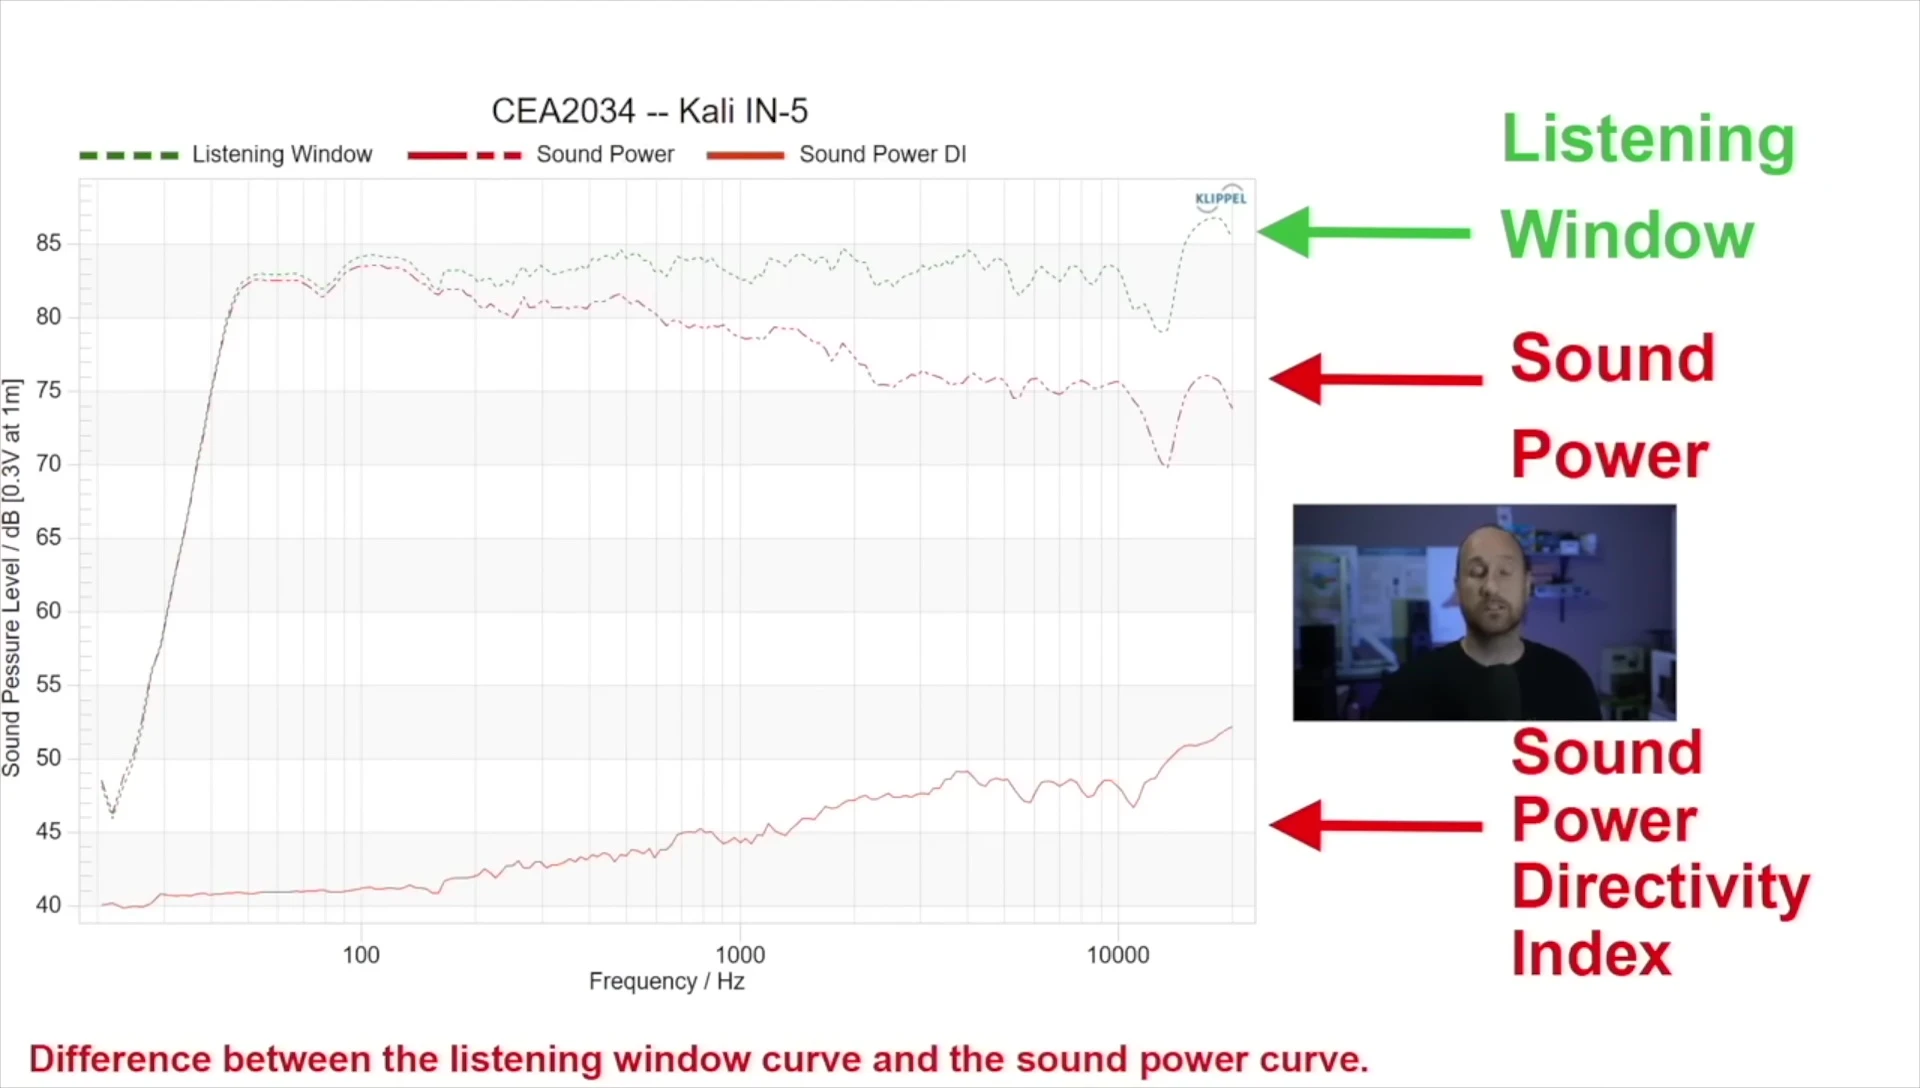
Directivity indices, including early reflections DI and sound power DI, compare the listening window to early reflections and sound power, respectively. These reveal how directional the sound is at different frequencies. A high directivity index suggests focused sound, while a low index indicates more omnidirectional radiation.
The directivity index offset line (often a zero dB line) serves as a reference, showing the speaker's overall directivity characteristics. Values above this line indicate primarily forward-facing sound, while values below indicate more rearward energy distribution.
Analyzing the Data: What to Look For
The ideal on-axis response is flat and smooth, indicating accurate sound reproduction across the frequency spectrum. Deviations can signify issues with the speaker's design or components.
The listening window should generally track the on-axis response. Significant discrepancies may indicate directivity issues, crossover problems, or resonances within the speaker’s cabinet.
Examine the early reflections and sound power for consistency with the on-axis and listening window responses. Smooth curves are ideal; abrupt peaks or dips might suggest resonances or other problems.
Case Studies: KEF R3 vs. Klipsch Heresy IV
The KEF R3 showed a mostly flat on-axis response with minor deviations and a listening window that tracked well. Minor issues around 3kHz could possibly indicate crossover interaction.
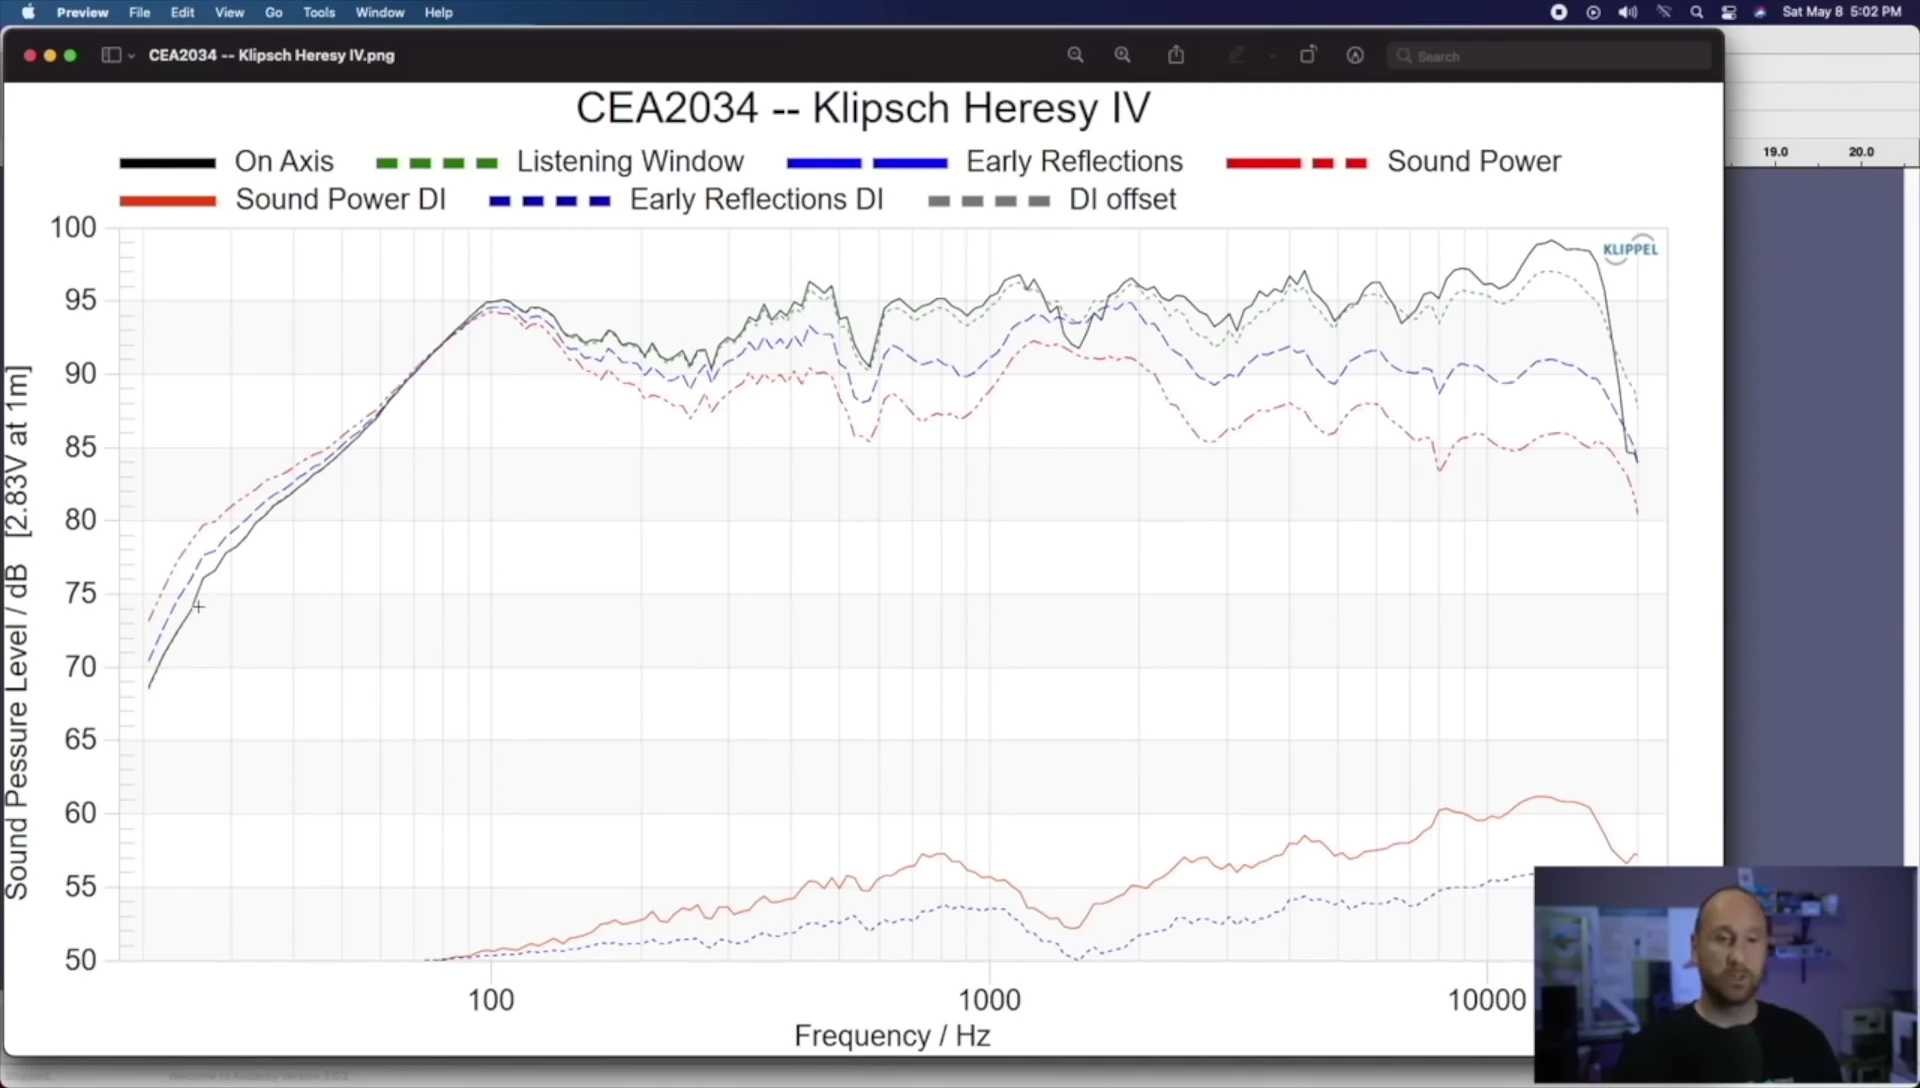
The Klipsch Heresy IV revealed a more problematic on-axis response, featuring dips and peaks across the spectrum, particularly in the midrange. The listening window, while tracking the on-axis response, highlighted similar issues.
The early reflections and sound power data for the Klipsch Heresy IV confirmed the presence of resonances and potential crossover problems. The analysis revealed considerable energy inconsistencies, potentially impacting audio fidelity.
Conclusion: Choosing the Right Speaker
Based on the analysis of Spinorama data, the KEF R3 showcases better overall performance than the Klipsch Heresy IV. Its smooth frequency response and consistent directivity across frequencies result in more accurate sound reproduction.
The Klipsch Heresy IV, while potentially capable of high volume, exhibits significant issues with frequency response, resonance, and crossover interaction. These issues compromise audio fidelity, making it a less ideal choice for those seeking accurate sound reproduction.
Ultimately, the choice between these speakers depends on individual priorities. The KEF R3 prioritizes fidelity, making it ideal for listeners valuing accuracy. The Klipsch Heresy IV may appeal to those prioritizing loudness over precise sound reproduction, but may not meet expectation of users sensitive to sound quality.