Choosing the right speakers can be overwhelming, with countless models and subjective reviews often leaving consumers confused. This comprehensive guide cuts through the noise, providing a clear understanding of speaker measurements and their significance in informed purchasing decisions. We delve into the world of objective data, emphasizing the importance of moving beyond personal opinions and focusing on measurable characteristics to assess speaker performance.This guide focuses on the crucial role of frequency response in speaker evaluation. Learn how to interpret frequency response graphs, understand the difference between on-axis and in-room measurements, and utilize this data to compare speakers objectively. By understanding these fundamental concepts, you can confidently navigate the speaker market and choose a model that perfectly matches your listening preferences and acoustic environment. This empowers you to make a purchase based on factual data, supplementing—rather than replacing—your own listening experience.
Pros And Cons
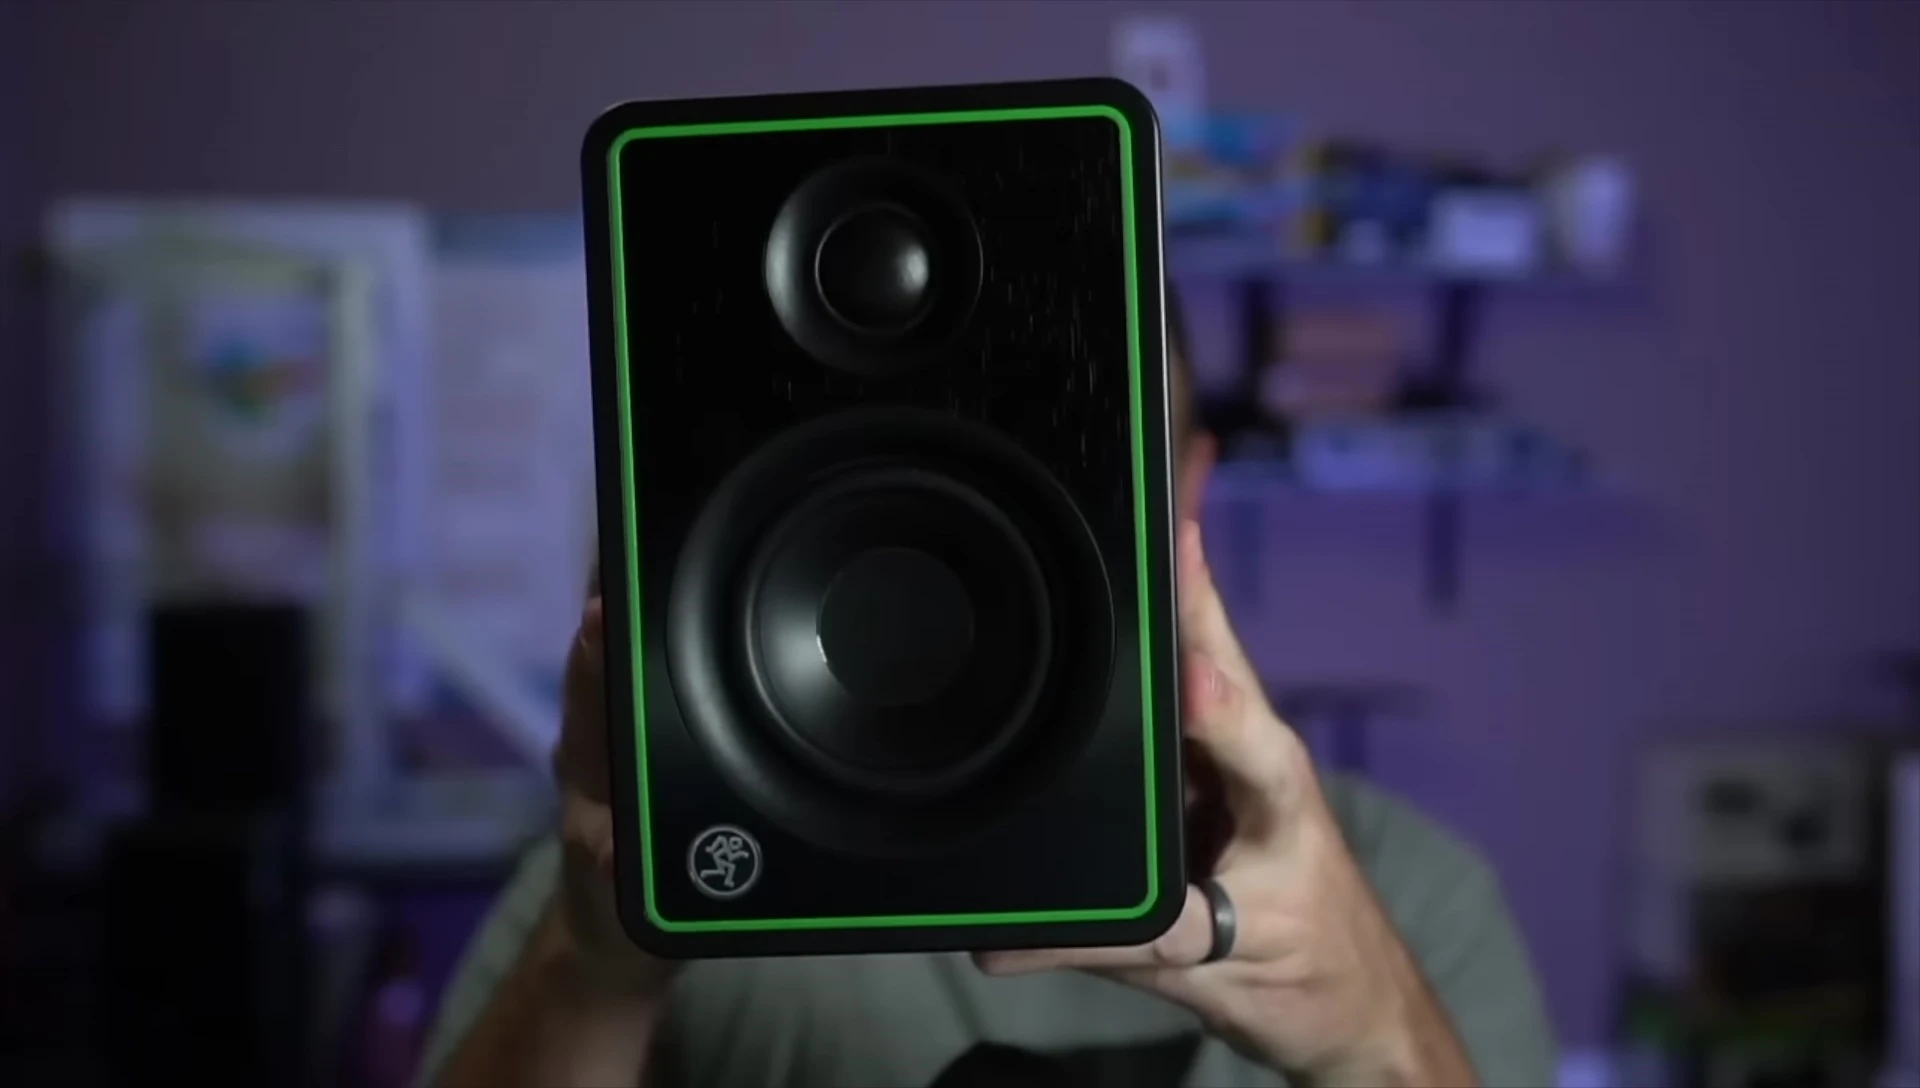
- Mostly within the plus or minus 1.5dB window for frequency response in the typical human voice region (300Hz-3kHz).
- Jumps outside the plus or minus 1.5dB window at a few points, entering the plus or minus 3dB window.
- Outside the plus or minus 3dB window at very high frequencies.
- Lacks significant bass output below 50Hz, typical for bookshelf speakers.
Read more: Top 5 Best Bluetooth Speakers 2025: Ultimate Guide & Reviews
The Importance of Objective Data in Speaker Reviews
Subjective audio reviews often fall short, relying heavily on personal opinions. This can be misleading, as individual hearing preferences and sensitivities vary widely. To provide truly helpful information, objective data is crucial, enabling listeners to make informed decisions based on measurable characteristics.
Objective measurements provide a consistent benchmark, independent of personal biases. This allows for comparison across different speakers and helps identify strengths and weaknesses in a speaker's performance, regardless of the reviewer's personal listening preferences.
Data-driven reviews focus on measurable aspects such as frequency response, distortion, and impedance, ensuring that the evaluation is transparent and repeatable. The goal is to empower consumers with the knowledge to choose speakers tailored to their individual needs and listening environments.
Understanding Frequency Response: On-Axis vs. In-Room
Frequency response describes how a speaker reproduces sound at different frequencies. A flat frequency response, ideally, means the speaker accurately reproduces all frequencies without boosting or cutting any particular range.
On-axis measurements are taken directly in front of the speaker, eliminating room influences. This isolated measurement reveals the speaker's inherent characteristics. In-room measurements capture the combined response of the speaker and the listening environment, which is significantly affected by room acoustics.
The distinction between on-axis and in-room measurements is crucial for accurate speaker evaluation. On-axis measurements offer a baseline understanding of the speaker's performance independent of room acoustics, while in-room measurements reflect the actual listening experience.
Interpreting Frequency Response Graphs
Frequency response graphs typically plot frequency (Hz) on the horizontal axis and sound pressure level (SPL, in dB) on the vertical axis. A flat line indicates an even reproduction across all frequencies.
The ideal speaker will have a mostly flat response within the typical human hearing range (20 Hz to 20 kHz). Deviations from flatness indicate the speaker's coloration of the sound, which might be desirable depending on individual preferences.
Analyzing the graph allows you to identify frequency ranges where the speaker might boost or cut specific sounds, potentially affecting the overall sound quality. Consider factors such as the intended use of the speaker and personal preferences when interpreting deviations from a perfectly flat response.
On-Axis Measurement and its Significance
On-axis measurements provide a fundamental understanding of the speaker's inherent sonic characteristics, free from the influence of room reflections and boundary effects.
This data is essential for comparing different speakers objectively, as it isolates the speaker's performance from the variability introduced by different listening environments.

By understanding on-axis response, consumers can better predict how a speaker will perform in various room setups and make more informed purchasing decisions based on its inherent sound reproduction capabilities.
Conclusion: Making Informed Decisions with Speaker Data
Understanding speaker measurements, particularly frequency response, empowers consumers to move beyond subjective reviews and make more informed purchasing decisions. By understanding the data, you can choose speakers that align with your specific needs and preferences.
While subjective impressions are valuable, objective data provides a crucial layer of information, ensuring transparency and allowing for comparison across different models. The combination of objective data and subjective listening experiences leads to more confident purchasing decisions.
This guide emphasizes the importance of understanding on-axis frequency response as a fundamental starting point for speaker evaluation. Further exploration of other objective measurements can enhance this understanding and improve decision-making in speaker selection.